
The recent underperformance of technology stocks has sparked discussions about market dynamics and portfolio concentration. While artificial intelligence-driven companies have been key market drivers in recent years, their dominance has raised questions about market sustainability and potential risks. What does the changing landscape mean for investors seeking balanced, longterm returns?
Market gains are expanding beyond technology names
Understanding the relationship between tech stock performance and broader market health is crucial. While these companies have demonstrated impressive growth trajectories, their elevated valuations present both opportunities and risks. Market leadership naturally rotates between sectors and stocks as market conditions evolve, suggesting diversification remains a key strategy.
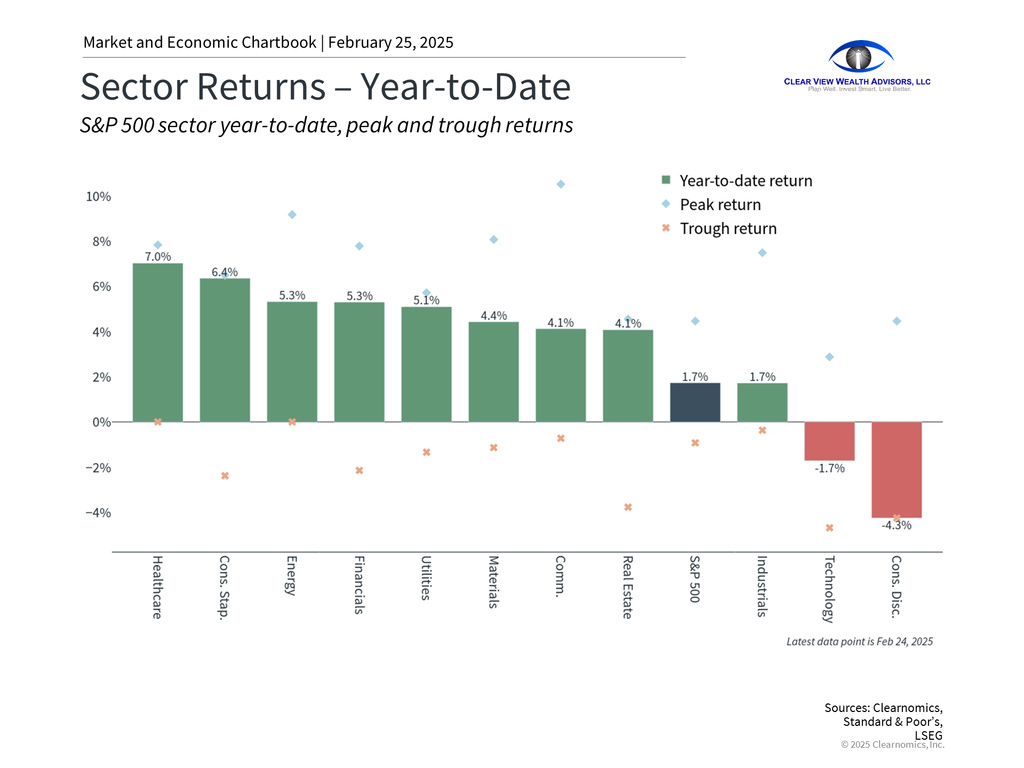
Early 2025 has witnessed Information Technology and Consumer Discretionary sectors trailing the broader market. This marks a significant shift from the period since late 2022, when these tech-heavy sectors, along with Communication Services, led market gains. Meanwhile, sectors such as Financials, Materials, and Consumer
Staples have emerged as positive contributors.
Several factors explain this rotation, including valuation concerns, persistent high interest rates, and questions surrounding AI investment returns. The S&P 500's price-to-earnings ratio now stands at 22x, nearing dot-com era highs, while the Information Technology sector commands an even higher 27.7x multiple. Though AI infrastructure investment continues to grow rapidly, global competition has intensified.
The expansion of market participation beyond tech represents an encouraging development for investors seeking broader market strength. This year's early trend toward wider participation suggests a more balanced market environment, reflecting investors' search for value across diverse market segments following extended periods of strong returns.
While technology stocks offer growth potential, they inherently carry higher volatility and economic sensitivity. The sector experienced significant drawdowns in 2022, with both the Nasdaq and S&P 500 Information Technology sector declining approximately 35% before recovering.
Such patterns have historical precedent, with the dot-com crash of 2000 being the most notable example. Similar dynamics played out in the 1960s technology boom, when popular technology and electronics stocks traded at premium valuations before experiencing substantial declines during the 1970s market downturn
Technological innovations - from semiconductors to large language models - ultimately benefit companies across sectors. The digital transformation that began in the 1990s continues to evolve. Long-term investors should maintain diversified exposure to capture these broader trends rather than attempting to time sector rotations.
Market concentration remains a key consideration
Market sector composition significantly influences overall market behavior. The S&P 500's makeup has evolved considerably over the past decade, with the Magnificent 7 technology-related companies now holding dominant positions: Apple, Nvidia, Microsoft, Amazon, Alphabet, Meta, and Tesla.
The substantial market influence of a select few stocks raises sustainability concerns among investors. This concentration risk represents potential vulnerability from overexposure to specific sectors or investments. Many portfolios may have unknowingly increased their tech exposure as these companies have grown within major indices
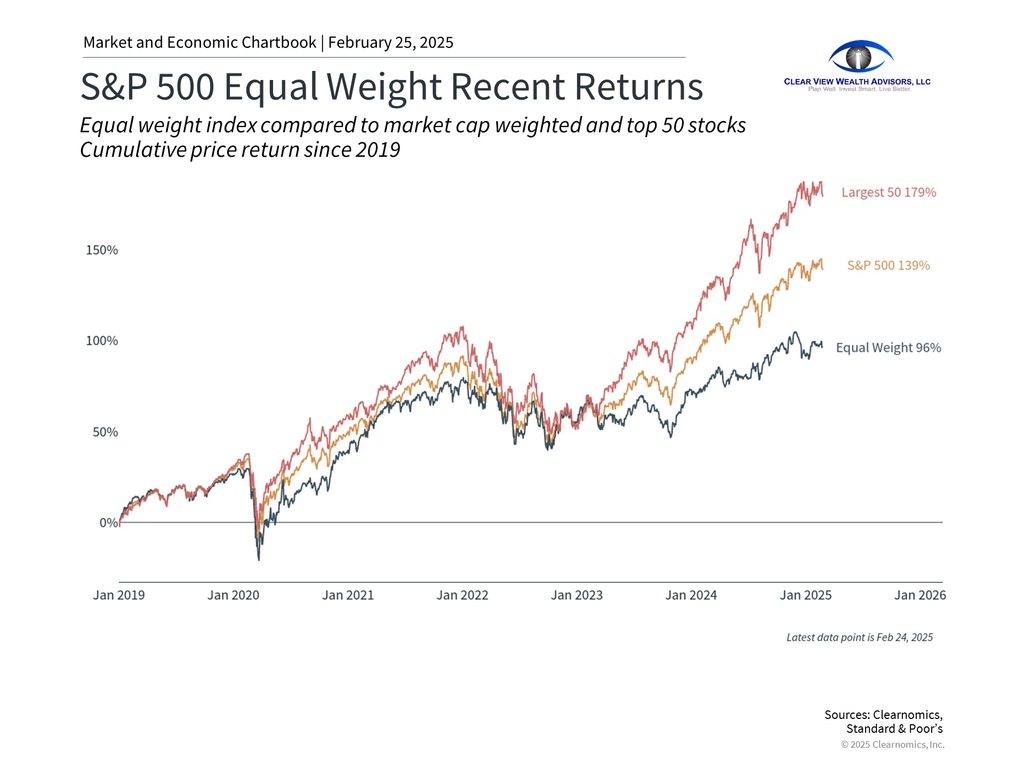
A useful comparison can be made between the market-cap weighted S&P 500 index and its equalweighted counterpart. While the former reflects actual market composition, equal weighting provides broader exposure to company performance regardless of size.
Concentration can magnify both positive and negative returns, much as diversification helps manage risk. Regular portfolio monitoring and rebalancing may be necessary in this environment to maintain appropriate risk levels. Working with a trusted advisor who understands your financial objectives is valuable for portfolio management.
Multiple sectors drive returns across market cycles
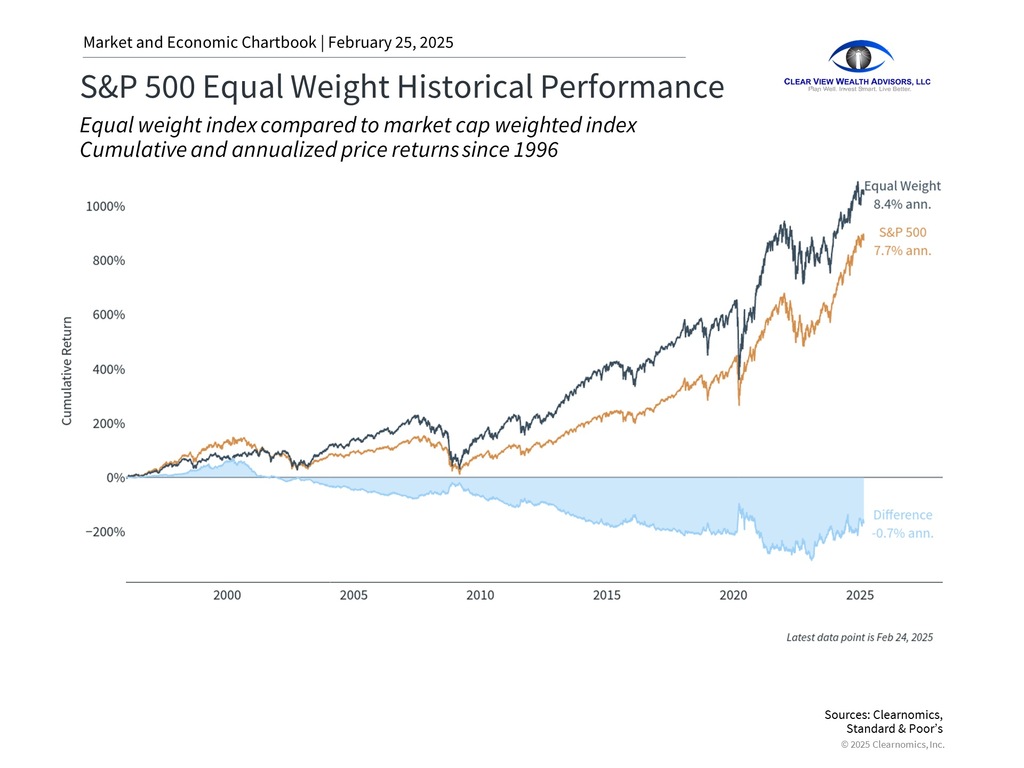
While recent years have seen technology stocks dominate market returns, this hasn't always been the pattern. Historical data demonstrates that over extended periods, the S&P 500's success has been driven by numerous stocks across sectors.
Historically, market leadership by the largest companies hasn't been constant. For much of market history, blue chip stocks were often viewed as stable dividend sources rather than growth leaders.
While enthusiasm for artificial intelligence stocks persists, investors should maintain broad market exposure. If AI's impact matches expectations, its economic benefits could extend further and longer than previous technological revolutions, benefiting diversified portfolios
The bottom line? Despite tech sector weakness, maintaining disciplined exposure across market segments remains the most effective long-term investment approach.
Steve's View ...
Portfolio Allocation for MarketFlex Portfolios:
The Outlook:
In light of market uncertainty about trade, tariff, tax, immigration, and fiscal policies being offered out of Washington, the market has been resilient. While shocks to the system are quite possible, business metrics and profits are still supporting growth. Countering the reality of profitability, market sentiment is very likely to drive results and volatility. Recent weak housing data and consumer sentiment have been thought of as behind the recent sharp fall in US stocks (as of Friday, 2/22/2025). Many market commentators note that this change in sentiment may be driving short-term rotation from expensive stocks and markets to less expensive stocks and markets (such as markets in Europe). Historically, value-oriented stocks, which are typically less expensive than growth-oriented stocks (like tech) have benefited from such rotation.
Ultimately, the goal should be to maintain balance between value and growth. And to counter the "rich" valuations in the market, investors may want to consider adding more "equal weight" index funds (like RSP ETF) over traditional "market cap" index funds (like SPY or VOO ETFs). This may help reduce exposure to the Magnificent 7 and its concentration risk.
Aside from this, the MarketFlex portfolios remain meaningfully allocated to stocks (over 55% on average) and equity-like "alternatives" like "defined outcome" ETFs (about 10%). While Fed policy is not expected to be changed anytime soon (or September at the earliest), fixed-income exposure continues to be shorter-term (like FLOT ETF), corporate (like VCIT ETF), and high-yield (like RISR ETF). Cash and near-cash allocations into high-yield money markets are generally high in the 3% to 5% for most portfolios so that there is a buffer as well as "dry powder" in case a buying opportunity opens up.
Information provided in these materials has been drawn from resources deemed reliable. Clear View Wealth Advisors, LLC ("RIA firm") and Steve Stanganelli, CFP(r) ("Advisor") may provide additional commentary accompanying the materials. Any commentary by the source materials may differ from opinions expressed by the Advisor or RIA firm. Commentary and opinions of the Advisor and RIA firm are provided in good faith.
Chart books, newsletters, and related materials are distributed for general informational and educational purposes only and are not intended to constitute legal, tax, accounting or investment advice. All investments involve risk, including loss of principal, and past performance of a security, cryptocurrency, financial product, or strategy does not guarantee future results. Neither the RIA Firm nor the Advisor represent that the securities, cryptocurrencies, products, or services discussed in any of these materials or related websites are suitable for any particular investor. You are solely responsible for determining whether any investment, investment strategy, security, cryptocurrency, or related transaction is appropriate for you based on your personal investment objectives, financial circumstances and risk tolerance. You should consult your business advisor, attorney, or tax and accounting advisor regarding your specific business, legal or tax situation.
Any investments or strategies mentioned may not be suitable for all investors. Investors should consider the investment objectives, risks, and charges and expenses of any investment before investing. Investors are advised to consult with their financial and/or tax advisors and refer to any prospectus for any investment
Copyright (c) 2025 Clearnomics, Inc. All rights reserved. The information contained herein has been obtained from sources believed to be reliable, but is not necessarily complete and its accuracy cannot be guaranteed. No representation or warranty, express or implied, is made as to the fairness, accuracy, completeness, or correctness of the information and opinions contained herein. The views and the other information provided are subject to change without notice. All reports posted on or via www.clearnomics.com or any affiliated websites, applications, or services are issued without regard to the specific investment objectives, financial situation, or particular needs of any specific recipient and are not to be construed as a solicitation or an offer to buy or sell any securities or related financial instruments. Past performance is not necessarily a guide to future results. Company fundamentals and earnings may be mentioned occasionally, but should not be construed as a recommendation to buy, sell, or hold the company's stock. Predictions, forecasts, and estimates for any and all markets should not be construed as recommendations to buy, sell, or hold any security--including mutual funds, futures contracts, and exchange traded funds, or any similar instruments. The text, images, and other materials contained or displayed in this report are proprietary to Clearnomics, Inc. and constitute valuable intellectual property. All unauthorized reproduction or other use of material from Clearnomics, Inc. shall be deemed willful infringement(s) of this copyright and other proprietary and intellectual property rights, including but not limited to, rights of privacy. Clearnomics, Inc. expressly reserves all rights in connection with its intellectual property, including without limitation the right to block the transfer of its products and services and/or to track usage thereof, through electronic tracking technology, and all other lawful means, now known or hereafter devised. Clearnomics, Inc. reserves the right, without further notice, to pursue to the fullest extent allowed by the law any and all criminal and civil remedies for the violation of its rights.